Drag and Drop OrgChart Support and Help
Thank you for using interest in using the Drag and Drop Organization Chart by WorkforceVision. For any issues related to the visual, contact us via email: IraWatt@WorkforceVision.co.uk
For details on how data is handled and secured within the visual, please refer to our Data Security and Flow Overview Page.
Product Description
Effective strategic workforce planning and organizational design are crucial for the success of any business. By structuring your organization thoughtfully, you can ensure that resources are allocated efficiently, roles and responsibilities are clear, and future growth is supported. This visualization tool is designed to help you achieve these goals by providing:
1)Comprehensive Visualization: The ability to visualize thousands of employees in a single org chart, offering a clear and comprehensive view of your entire organization at a glance.
2)Customizable Node Colors: Customize node colors to align with your business’s branding or to highlight specific departments, roles, or other categorizations important to your organization.
3)Enhanced Node Details: Add extra details to nodes, such as employee roles, contact information, and performance metrics, ensuring that all relevant information is easily accessible.
4)Interactive Customization: Utilize drag-and-drop functionality to easily modify your org structure. Add or remove nodes to reflect changes in your organization dynamically and intuitively.
5)Built-In Search Functionality: Quickly locate specific employees within your organization using the built-in name search feature, enhancing navigability and saving time.
Use this powerful tool for a variety of scenarios:
1)Organization Restructures: Seamlessly plan and implement restructures, ensuring that changes are clearly visualized and communicated.
2)Mergers and Acquisitions: Integrate and align organizational structures during mergers and acquisitions, identifying overlaps and opportunities for synergy.
3)Identifying Structural Problems: Detect and address structural issues such as bottlenecks, redundant roles, or imbalanced workloads, helping to improve overall efficiency and effectiveness. Harness the power of this tool to optimize your organizational design, support strategic workforce planning, and drive your business forward.
Basic Data Requirements
1) Ensure this is a unique ID for every Employee ID.
2) The top node/s should have a blank Manager ID.
3) A Employee ID should not have the same Manager ID as itself.
Data Fields and their Requirements:
Employee ID: This field can be a number or string/text. It should be unique to each employee.
Manager ID: This field can be a number or string/text. It does not have to be unique. However, if the Manager ID is not present among the Employee IDs, the node will not be linked to anyone.
Name: This field can contain string/text data.
Job Title: This field can contain string/text data.
Dotted Line Reporting:
The dotted line field requires text data in a JSON format like this:
[{ "ManagerID": “E1”, "Comment": "Replacing", "Color":"#FF0000" }]
It is key that you use the exact formatting as above and just change the values such as “E1” or the “Replacing”. A good way to check the JSON is valid is with an online checker: JSON Checker - The JSON Validator and Formatter. The managerID is the node the dotted line will connect/point to. The comment and colour are optional. If you want a node to have multiple dotted line connections, you can structure the data like below:
[{ "ManagerID": “E173”, "Comment": "Applied for Role" }, { "ManagerID": “E63”, "Comment": "Applied for Role" }]
An example of this working can be found on the download sample report on the App Source Page Org Chart Drag and Drop. I have also attached an example data file.
A technical description of the JSON is it is an JSON array contain ojects. Each object represents a connection. Each of object can have three properties ManagerID, Comment, and Color. All properties should have text values.
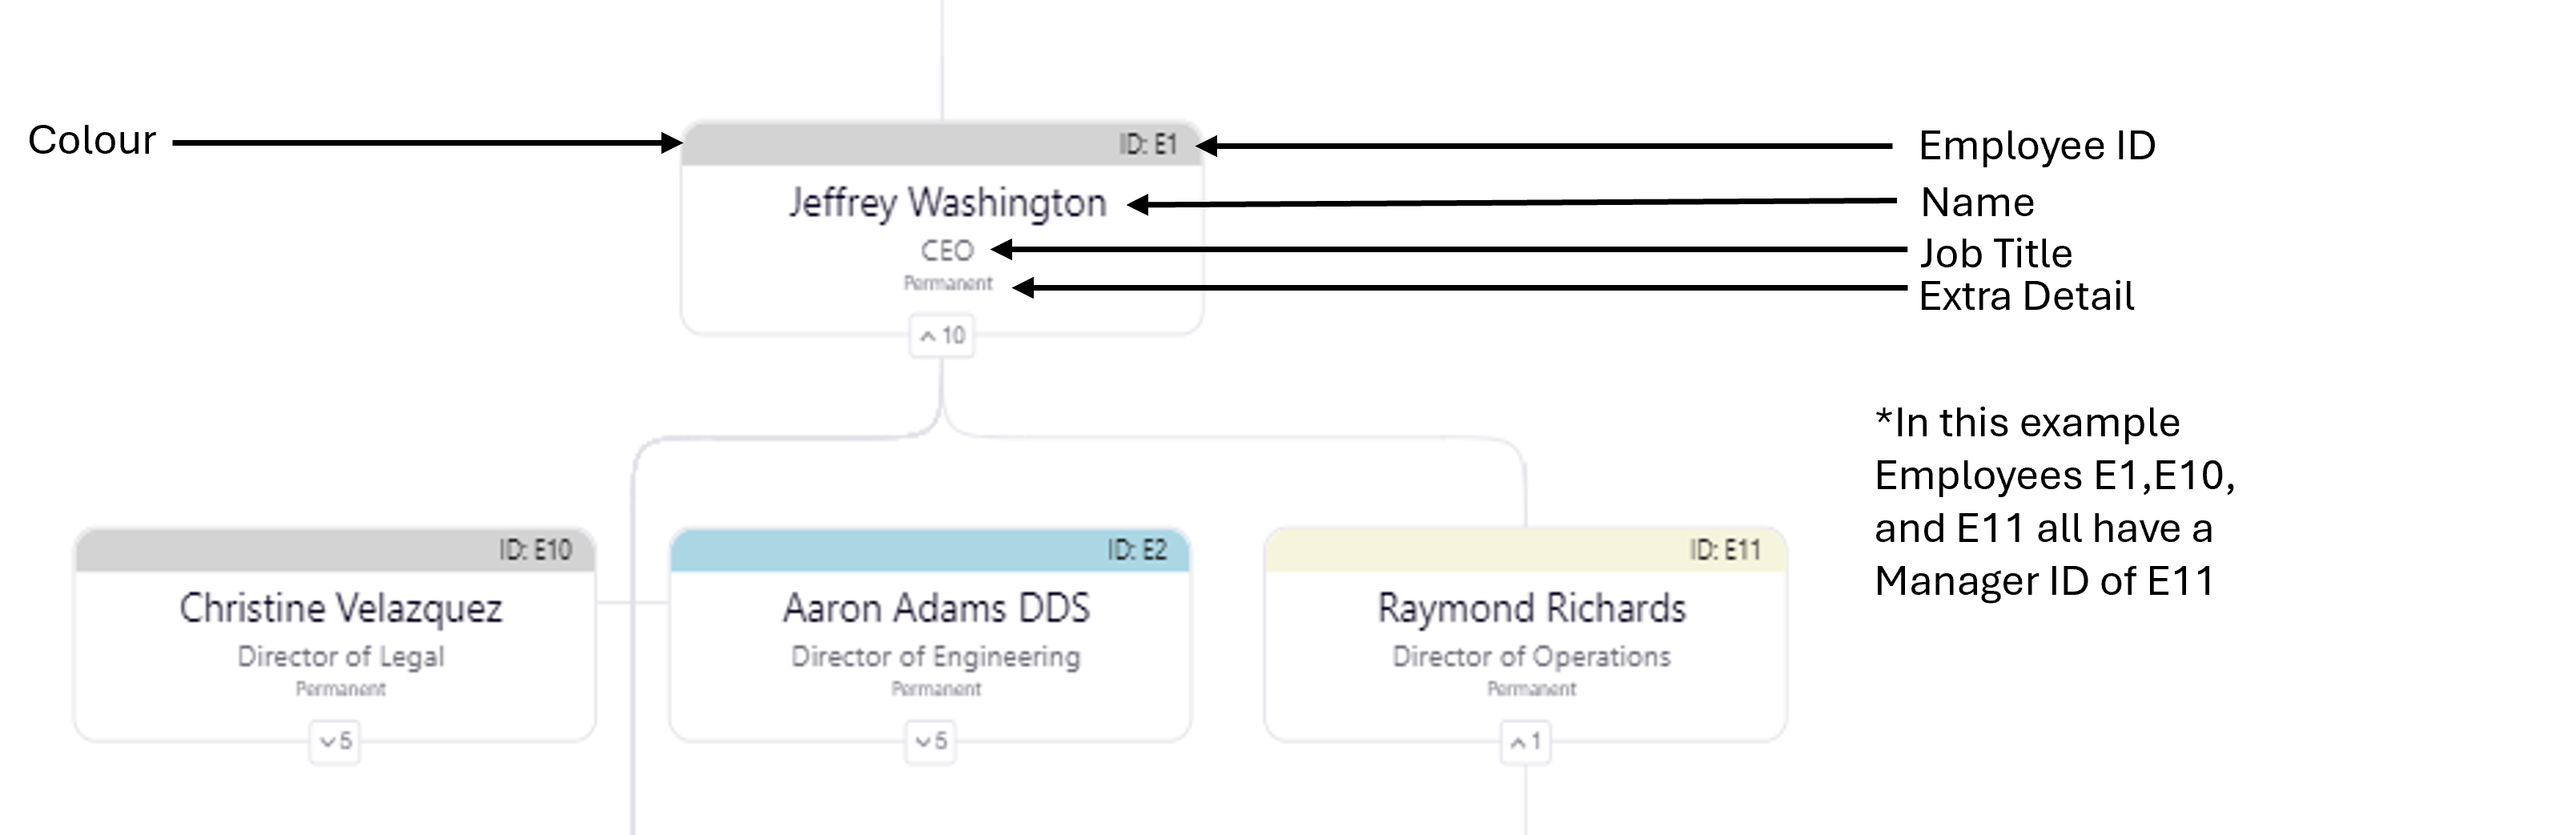
Colour: This field can contain string/text data. For this field to work, it should be a colour hexadecimal number (e.g., #FF5733) or a colour name recognizable by a browser (e.g., Red). For more details on hex colors, visit Colors HEX (w3schools.com). By default the colour will be grey and effects the band at the top of the employee card (shown below).
Extra Details: This field can contain string/text data. Where the fields are displayed on the visual for one row of data:
Extra Details: This field can be a number or string/text. Unlike other fields you can place multiple items into this field. This will create a new line for each item.
Picture: This field requires a 64bit encoded image in a text format. Power BI may restrict your text field to 32,766 characters. This may cause the image to only partially show. In order to convert an image and convert it to a size below the character limit we have placed an example for creating the image field, please note you must remove the "data:image/png;base64,data:image/png;base64," text from the beginning of your encoded image for it to render correctly:
1) Creating a 64Bit encoded image from an image file or folder containing images
To confirm the base64 text is valid this: Check the string:
• A valid Base64 string should only contain A–Z, a–z, 0–9, +, /, and optionally = as padding. N
• Use a validator: Try pasting the Base64 string into an online decoder (e.g. https://www.base64decode.net/base64-image-decoder), if it doesn't render an image, it's likely malformed.
• Re-encode properly: Ensure the image is encoded using a UTF-8-compliant tool and stored as plain text without special formatting or localisation.
Secondary/Cumulative Field: The Cumulative Field represents the total value of a node combined with the values of all its descendant nodes in the hierarchy. This field must be numeric and is displayed in the top-left corner of each node.
Functionality
Moving Nodes
To reorganize employee cards/nodes, simply press the "Organize" button at the top. Left-click on the node, hold down the left mouse button, and drag it to the desired location (any other employee card). You can continue doing this until you are satisfied with the new organization structure. If you make a mistake, you can revert a change with the "Undo" button at the top, and redo a change with the "Redo" button. You can also cancel the organization changes you just made with the "Cancel" button. moving a node will bring its reporting structure along with it.
Adding/Removing Nodes
To add or remove a node, click the "Add" or "Remove" button at the top of the visual. This will open a form where you can fill in the details of the node you want to add or remove. Use the "Submit" button to confirm your action or the "Close" button to cancel it. If the "Submit" button does not work, it is likely because the node you are trying to add already exists or the Manager ID you have provided does not exist. Removing a node will also remove its entire reporting structure. If you want to retain the reporting structure underneath a node, first move the subordinate nodes to a new reporting structure using the "Organize" button before removing the node.
Searching for Nodes
The name search bar at the top of the visual will highlight and show the location of any employee card/node whose name field partially or fully matches the search query. The search will only display potential matches when there are 10 or fewer possible matches but more than 0.
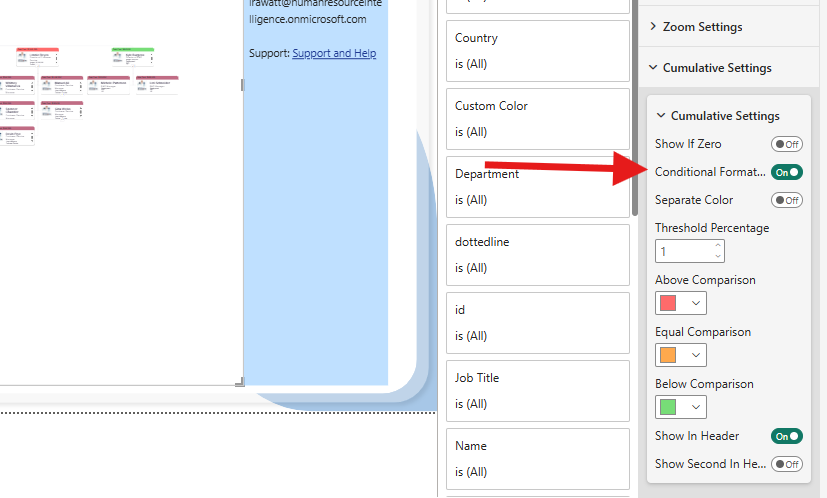
Conditional Formatting
Conditional formatting in the visual allows for dynamic colouring of nodes, which automatically updates whenever you refresh, move, edit, add, or remove nodes, making it especially useful for workforce and financial planning scenarios. To use conditional formatting, both cumulative fields must contain numeric values. Once enabled in the formatting settings (as shown in the screenshot below), the visual compares the first cumulative field against the second:
• Above comparison colour is applied if the first value is higher.
• Below comparison colour is applied if the first value is lower.
• Equal comparison colour is applied if the values are equal, or if they fall within a percentage range that you can define using the Threshold percentage option in the formatting settings.
Printing/PDFs
1) Press CTRL+P
2) On the left Select Print as PDF or Select a printer
3) Select Landscape
4) Select More Settings
5) Tick Background Graphics
6) Click Save/Print when you are ready