


Family Tree Support and Help
Thank you for using interest in using the Family Tree Chart by WorkforceVision. For any issues related to the visual, contact us via email: IraWatt@WorkforceVision.co.uk.
Product Description
Description An interactive family tree visual that makes exploring relationships across generations simple and engaging. This custom visual allows you to create and navigate family trees (genealogy charts) directly within Power BI. It is ideal for museums and history departments illustrating the lineage of kings, queens, and dynasties, as well as for genealogists and individuals mapping their own family and friends. Beyond historical contexts, it is also valuable for education and science, particularly in biology, where visualising genetic inheritance and kinship structures is key. With features such as interactive zooming and click-through navigation, the visual delivers a clear, intuitive way to understand complex relationships, making it a versatile tool for historical storytelling, genealogical research, and scientific education alike.
Data Requirements
1) All fields must be in text format, even if they contain numbers.
2) Each node in the tree must have its own row. For example, if node A has child B, then child B must also appear in the data table.
3) The ID field must always be populated.
4) When listing Spouses or Children IDs, separate each ID with a comma.
An example data table is included in this report for reference.
Interactivity & Functionality
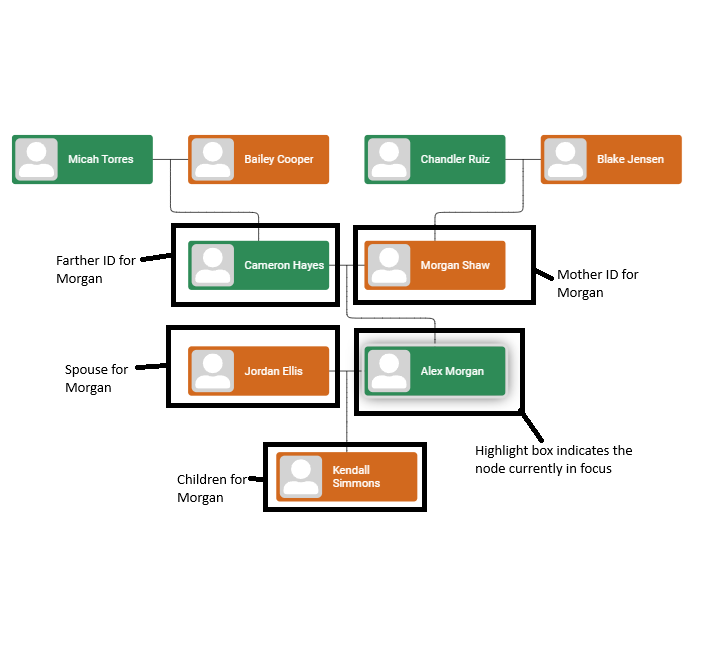
When opening the visual the node in focus will be the first row in your dataset. Selecting a node will display its parents (and their parents), as well as its spouses and children (and their children). To refocus on another node, simply click on it, and the relationships will automatically re-centre. Selecting a node can also filter other visuals in your report based on that node’s row. This interactivity can be toggled on or off in Power BI via Modeling → Manage Relationships.
Building the Visual
The Visual includes the following fields: ID: This field can be a string/text. It should be unique to each row.
Name: This field can be a string/text.
Mother ID: This field can be a string/text.
Farther ID: This field can be a string/text.
Spouces ID: This field can be a string/text, each ID should be comma separated.
Childrens ID: This field can be a string/text, each ID should be comma separated.
Colour: This field can contain string/text data. For this field to work, it should be a colour hexadecimal number (e.g., #FF5733). For more details on hex colors, visit Colors HEX (w3schools.com). By default the colour will be grey and effects the band at the top of the employee card (shown below). Where the fields are displayed on the visual for one row of data:
Contact We welcome feedback, ideas, and questions: Email: irawatt@humanresourceintelligence.onmicrosoft.com