

Data Flow and Security in the WorkforceVision “Org Chart Drag & Drop” Power BI Visual
Overview
The WorkforceVision Org Chart Drag & Drop is a Power BI custom visual certified by Microsoft and available through AppSource. Being a certified visual means it has passed Microsoft’s rigorous code reviews and testing to ensure it meets security and quality standards. A key aspect of these standards is data privacy, certified visuals are tested to confirm no data leaves the Power BI environment when you use them. See the full certification details on Microsoft Learn.
All data processed by this org chart visual remains within your Power BI session (whether in Desktop or the Power BI cloud service), and the vendor (WorkforceVision) cannot access your data.
Certified Custom Visuals and Data Handling
Power BI certified custom visuals must meet strict requirements that protect user data. Certified visuals are prohibited from making any external calls or transferring data outside of Power BI.
- Verified No-External-Communication: Microsoft confirms the visual’s code makes no outbound calls. See Power BI implementation planning.
- No Vendor Servers or Backends: The visual runs entirely in Power BI’s environment. WorkforceVision does not operate any external service.
- Privacy and Security: Your data is protected under Microsoft’s platform-level safeguards. Admins can restrict usage to certified visuals only.
Power BI’s Internal Data Handling and Visual Sandboxing
Power BI uses internal mechanisms and sandboxing to ensure data safety when visuals are rendered.
- In-memory Data Model: All report data is loaded into Power BI’s in-memory model, managed by the Power BI engine.
- Sandboxed Visual Execution: The visual executes inside a restricted iframe sandbox with no access to external services. Learn more on Power BI Community.
- Data Passed to the Visual: Only data bound to the visual is accessible to it, no hidden access to other datasets or visuals.
The sandboxed environment ensures visuals can only interact with the Power BI host through pre-defined APIs, with no access to external domains, or cookies.
Local Storage
If your tenant has enabled local storage, the visual may use Power BI’s Local Storage API V2. This allows the visual to store data in the browser’s local storage, isolated from other visuals. The visual uses this space to save any edits a user makes within it.
Each save contains only the user’s modifications (e.g., moving nodes, removing items, or editing details) rather than the entire dataset. For example, if a node includes a Name field and the user edits it, the save will capture the updated name along with the node’s ID to record the change.
Local storage saved data will automatically expire and be deleted after 29 days of inactivity and is limited to a maximum size of 100 KB.
Data Residency and Vendor Access
Here’s why your data stays private and never reaches WorkforceVision:
- No Data Leaves Your Environment: The visual makes no external network calls and operates entirely client-side.
- Vendor’s Role Limited to Code Submission: WorkforceVision submits the visual to Microsoft for certification and distribution. They have no live access to reports using the visual.
- Data Stays in Microsoft’s Cloud (or your Desktop): In Power BI Service, the data stays in Azure. In Power BI Desktop, it stays on your machine. Either way, it doesn’t leave Microsoft’s infrastructure.
The only way WorkforceVision would see your data is if you explicitly export or send it for support, outside normal usage.
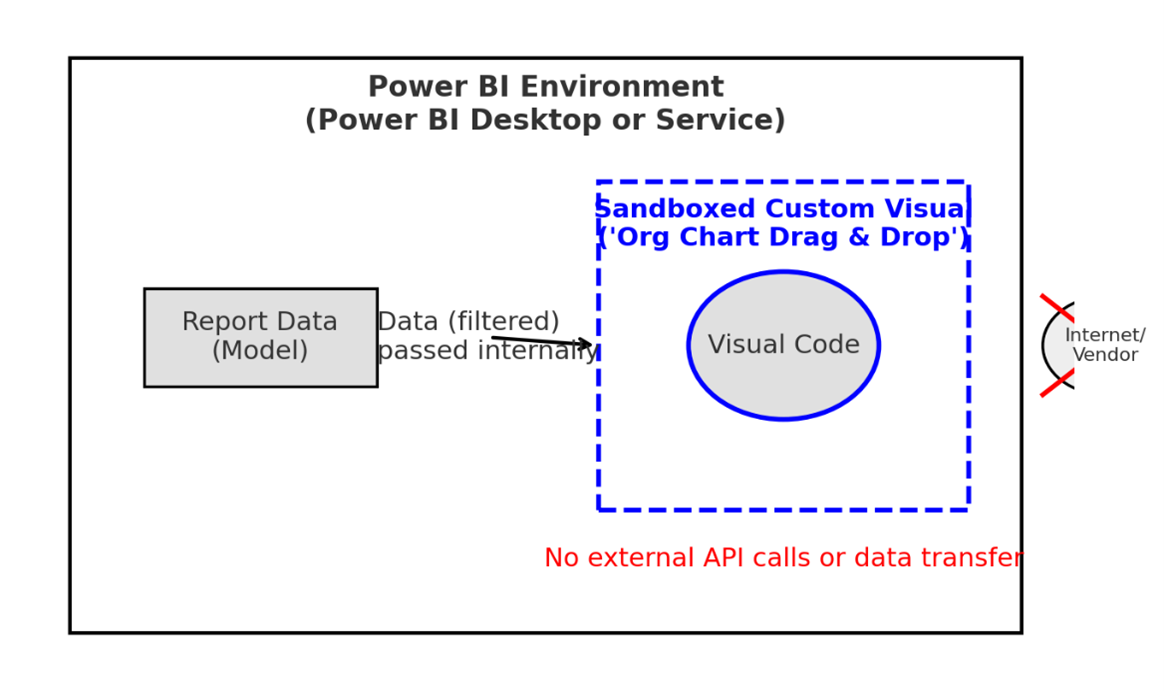
Diagram: Data Flow Within the Org Chart Visual
The diagram illustrates that all data remains within the Power BI environment if local storage is turned off whether on desktop or in the cloud. Data is retrieved from your model, passed into a sandboxed iframe (where the visual executes), and never exits to external networks. There are no outbound connections. Interactions like drag-and-drop are handled entirely inside the sandbox.